

Integrations
Prometheus - Upstash QStash Integration
To monitor your QStash metrics in Prometheus and visualize in Grafana, follow these steps:
Integration Scope
Upstash Prometheus Integration covers Prod Pack.
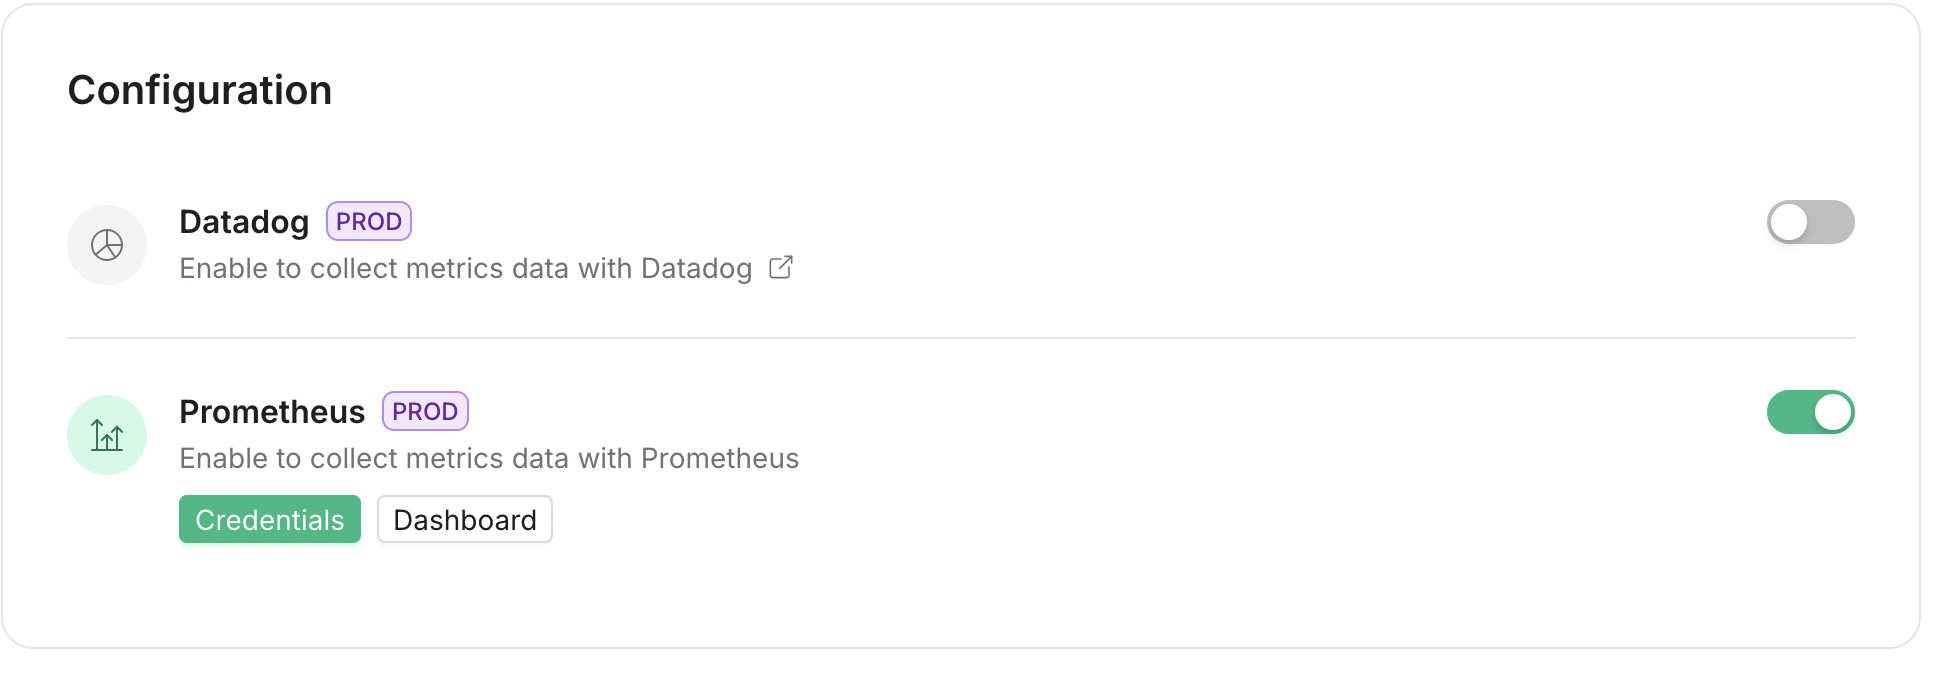
Step 1: Enable Prometheus in Upstash Console
- Open the Upstash Console and navigate to QStash.
- Go to Settings → Monitoring.
- Enable Prometheus to allow scraping QStash metrics.
Step 2: Copy Monitoring Token
- After enabling, a monitoring token is generated and displayed.
- Copy the token. It will be used to authenticate Prometheus requests.
Header Format
Send the token as Authorization: Bearer <MONITORING_TOKEN>.
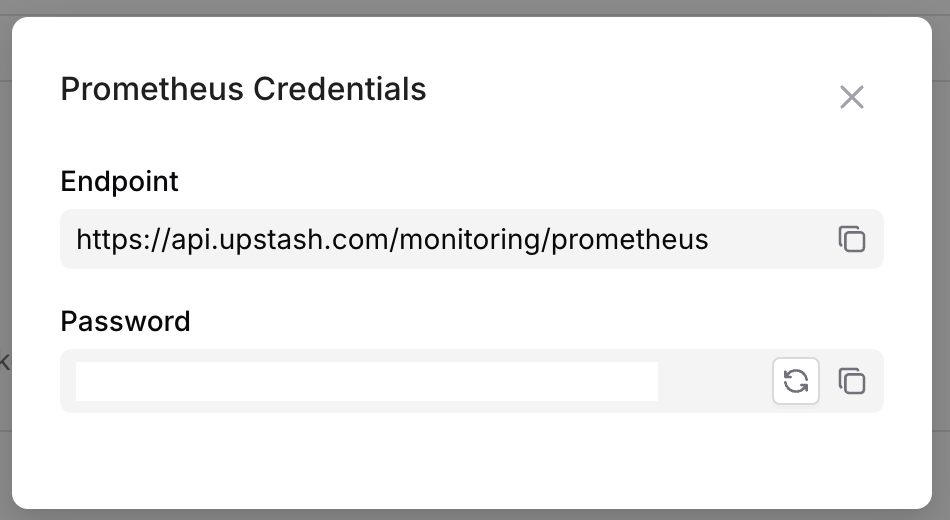
Step 3: Configure Prometheus (via Grafana Data Source)
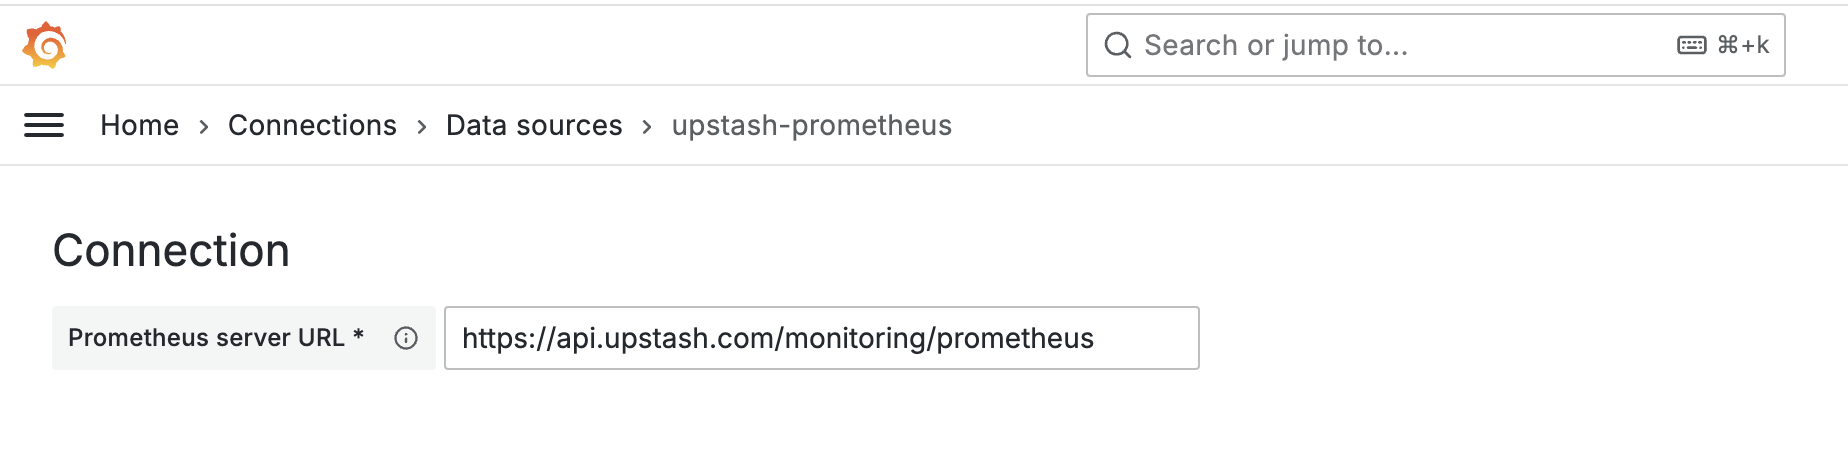
- In Grafana, add a Prometheus data source.
- Set the address to
https://api.upstash.com/monitoring/prometheus. - In HTTP headers, add the monitoring token.
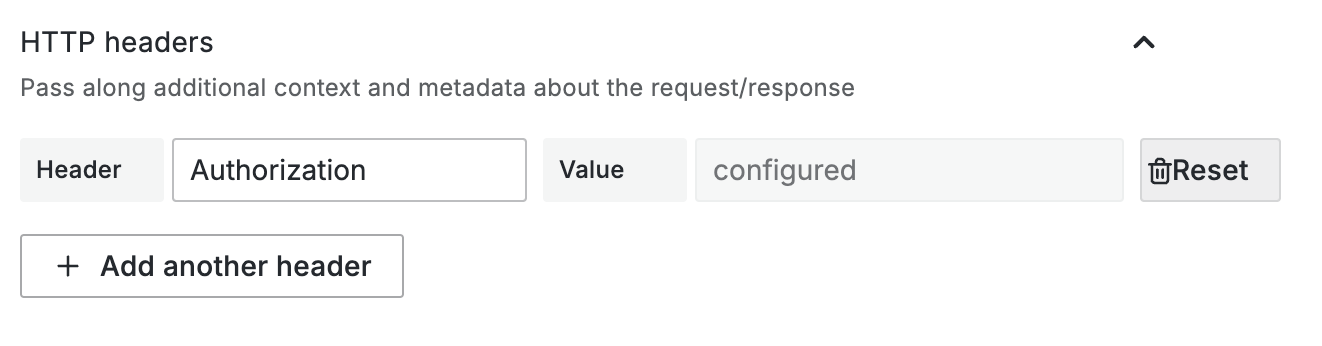
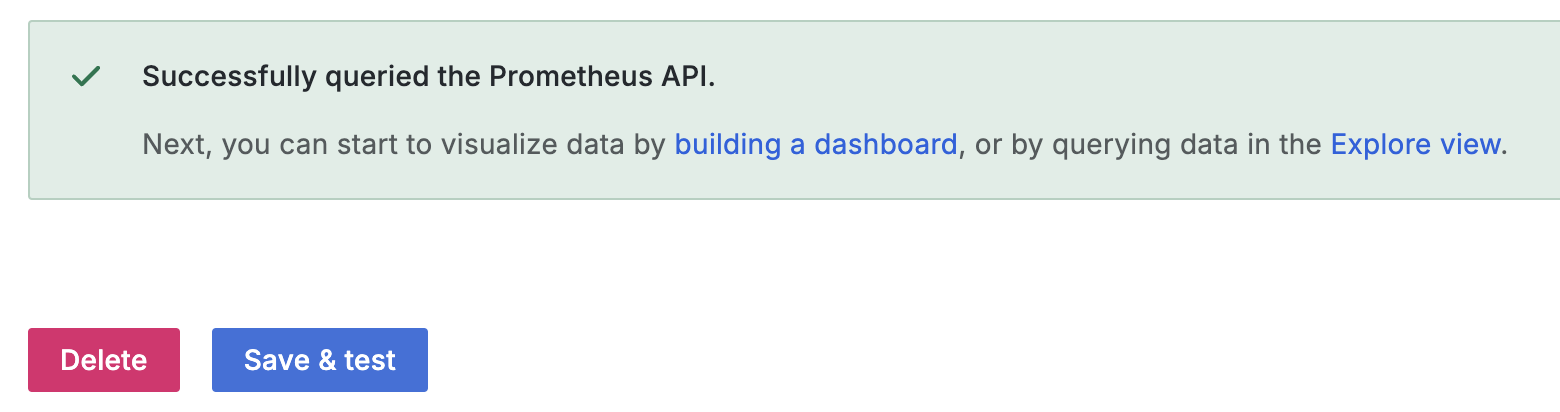
Click Test and Save.
Step 4: Import Dashboard
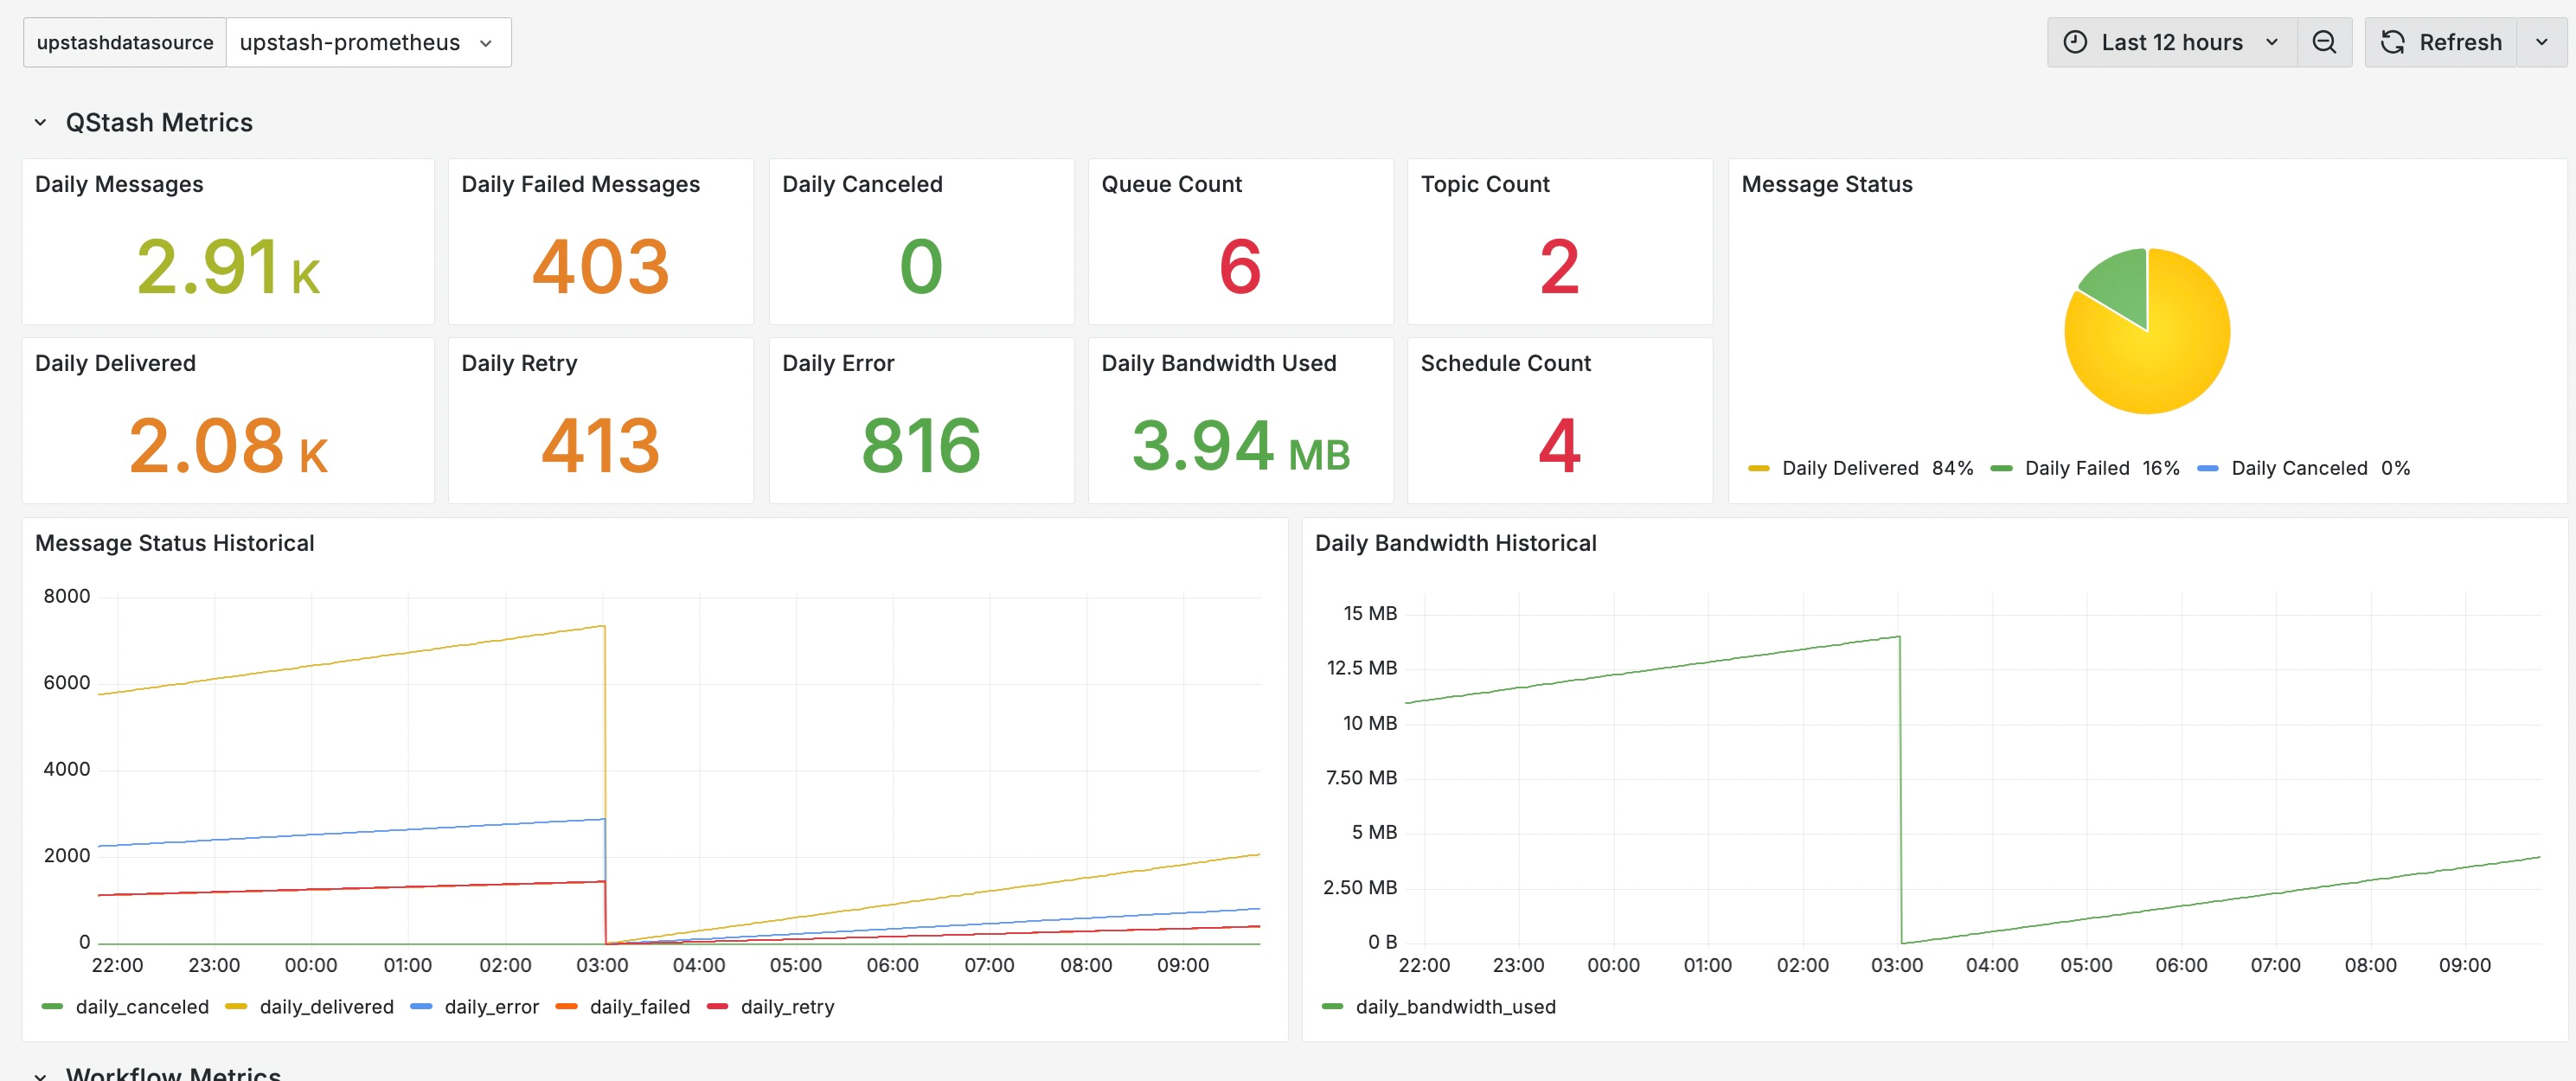
You can use the Upstash Grafana dashboard to visualize QStash metrics.
Open the import dialog and use: Upstash QStash Dashboard
Conclusion
You’ve integrated QStash with Prometheus. Use Grafana to explore message throughput, retries, DLQ, schedules, and Upstash Workflows.
If you encounter issues, contact support.